When COGs is more than just a number: engineering scalable cell and gene therapy manufacturing
How modelling helps organisations design manufacturing strategies that work in practice.
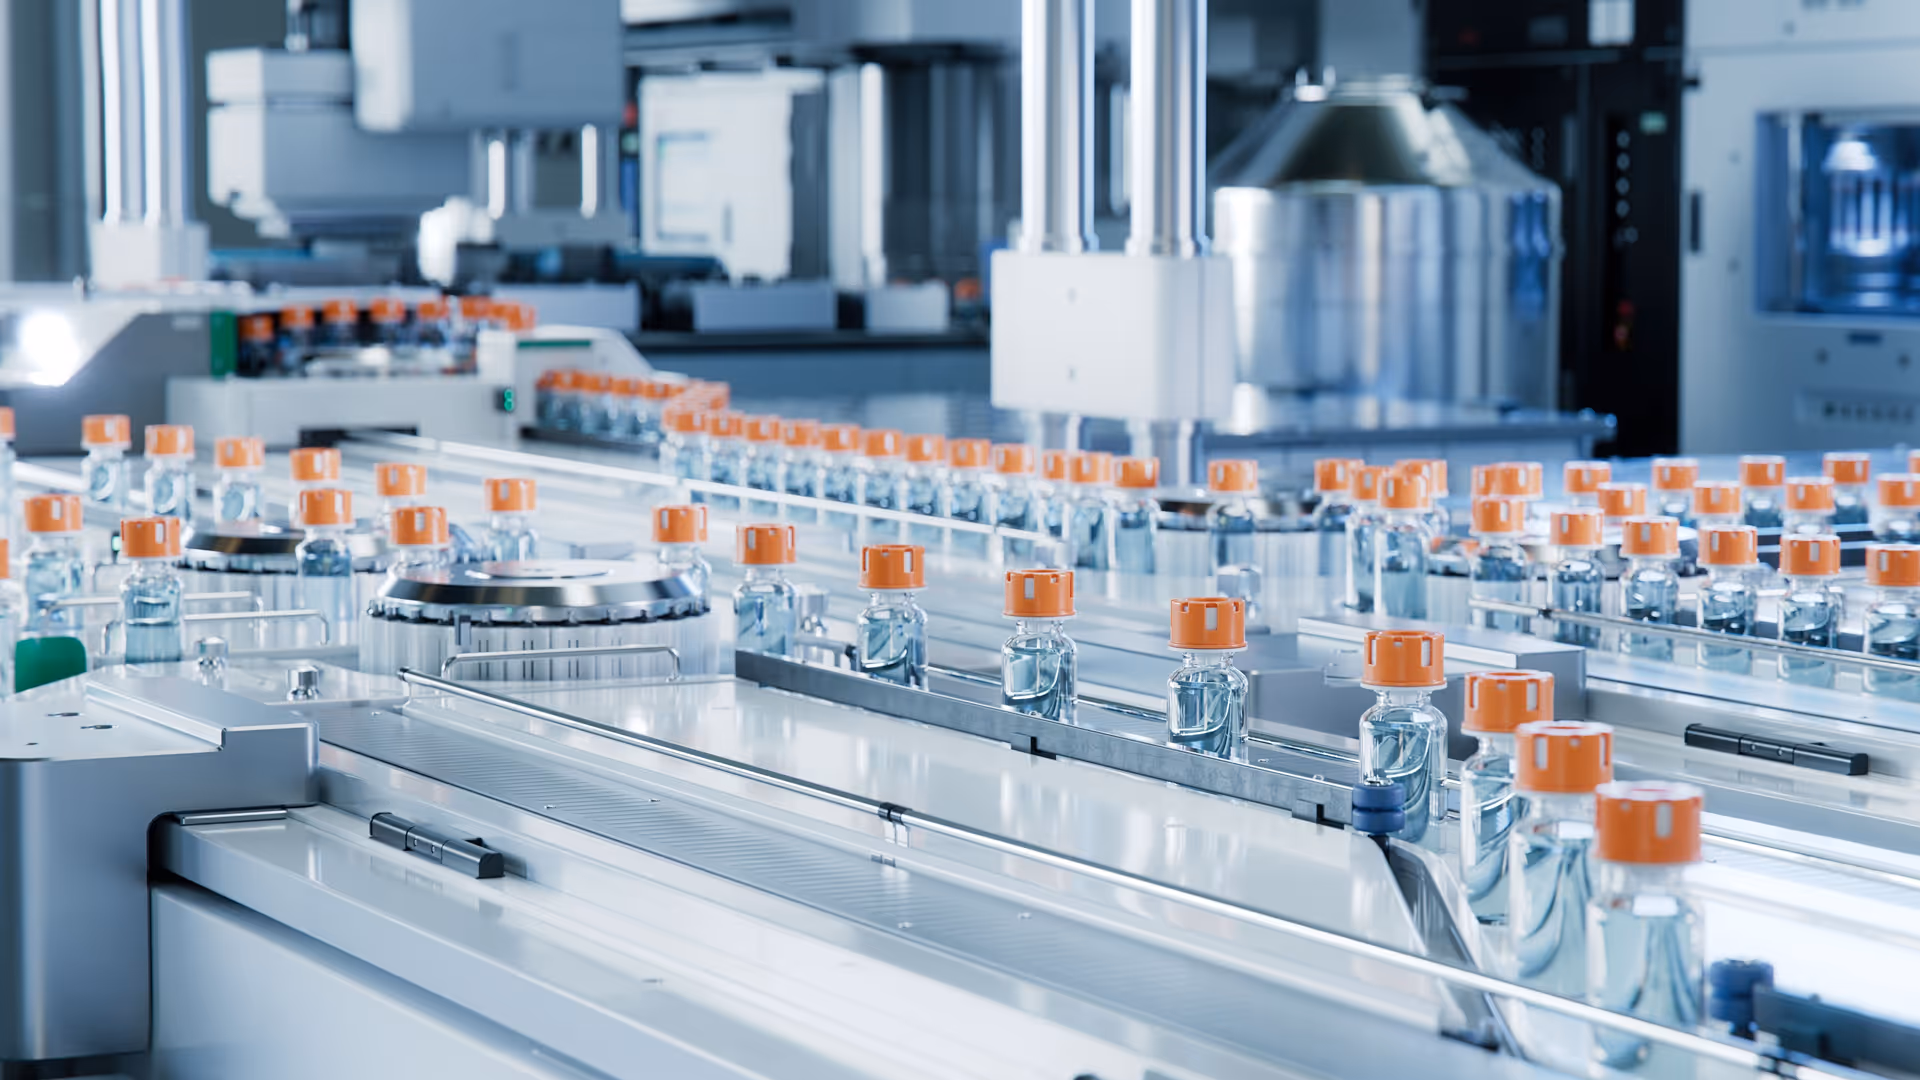
Cell and gene therapy (CGT) companies face growing pressure to demonstrate not only clinical efficacy, but also manufacturability at scale. In a field defined by complex, patient-specific workflows and evolving regulatory expectations, manufacturing strategy is no longer an operational detail. It is a determinant of patient access and commercial success.
Whitepapers
When COGs is more than just a number: engineering scalable cell and gene therapy manufacturing
How modelling helps organisations design manufacturing strategies that work in practice.
Cell and gene therapy (CGT) companies face growing pressure to demonstrate not only clinical efficacy, but also manufacturability at scale. In a field defined by complex, patient-specific workflows and evolving regulatory expectations, manufacturing strategy is no longer an operational detail. It is a determinant of patient access and commercial success.
Too often, discussions focus on a headline cost of goods sold (COGS) per dose. But profitability in CGT is driven less by standalone COGS figures and more by the ability to manufacture reliably, efficiently, and at scale. A process that appears economically viable in early development can become fragile, capacity-limited, or capital-intensive as demand grows.
This is where process modelling becomes critical. Rather than relying on static cost estimates, dynamic modelling evaluates how manufacturing workflows perform in practice.
Process modelling identifies bottlenecks, labour and facility constraints, equipment utilization limits, and scalability breakpoints, and highlights opportunities for significant manufacturing cost reduction at scale to ensure continued profitability, rather than continuing with a process that is less economically viable. It also highlights where automation, process closure, or technology substitution can reduce risk and improve resilience.
Most importantly, process modelling shifts the question from “What does a dose cost today?” to “How will this process perform at commercial scale?”
In this case study, we use a biotech company’s tumour-infiltrating lymphocyte (TIL) therapy as an example and demonstrate how process modelling can be applied to emerging modalities that are less well served by established equipment providers. We show how this approach can be transferred across therapeutic programs, helping organisations map pathways to scalability, identify operational bottlenecks, and highlight where targeted investment in process development and manufacturing capabilities is needed.
For biotech leaders, the question of commercial viability is the risk that causes greatest concern to investors and potential acquirers. Choosing the right approach doesn’t just provide incremental improvements, instead it delivers impact across scale-up deployment, launch timelines, security of supply, and investor confidence. Getting this modelling in place early creates a defensible manufacturing strategy that aligns clinical success with commercial reality.
The modelling approach
Process modelling starts with a detailed breakdown of existing manufacturing workflows, capturing the many distinct operator touchpoints across all types of unit operations.
For each step, the model captures:
Duration
Operator time
Equipment time
Facility requirements
Degree of parallelisation
Quantities of reagents and consumables
Steps are then grouped according to shared infrastructure needs, such as equipment and cleanroom grade, with associated capital costs amortised appropriately.
Once benchmark data for the current process are captured, the model can be scaled to evaluate the efficiencies achievable while retaining the existing process. This reveals where economies of scale exist and where they plateau.
The next step is to use the process model to simulate alternative scale-up strategies by varying critical operational parameters. Different configurations can be tested, including automation, process closure, equipment substitution, and facility redesign.
From here, the framework can be expanded to include additional cost drivers, such as installation costs, maintenance, and CDMO technology transfer. It can also be further refined to incorporate the manufacturing failure rates, which helps quantify the operational benefit of automation. Non-recurring development costs for new hardware or software platforms can also be integrated, allowing a more complete assessment of long-term investment decisions.
Rather than discovering limitations during late-stage scale-up, organisations can make informed, data-driven decisions early in development.
To see our process model in action, fill the form below.
Using a real-world example, see how our model enables companies to target development in the right areas, mitigating operational risks associated with labour-intensive, inconsistent, or difficult-to-scale processes.
Form unavailable due to browser restrictions.
Your current browser or privacy settings may prevent this form from appearing.
Please enable third-party scripts or submit your details through
[email protected].
Modelling CoGS for a TIL therapy
To illustrate how the modelling framework is applied in practice, we analysed an autologous TIL therapy for skin cancer. This approach is being explored to address unmet needs in solid tumours, where heterogeneity, antigen escape, and limited treatment options can reduce effectiveness. The workflow includes processing steps intended to enrich for the most therapeutically relevant T cell populations, improving manufacturing efficiency and potentially enabling lower effective dose sizes while supporting quality, efficacy, and safety objectives.
Compared with the more familiar autologous CAR-T workflows used in blood cancers, several important manufacturing differences exist:
Manufacturing starts with resected solid tissue, from which T cells are extracted. The tumour-derived T cells are heterogeneous; therefore, strategies are employed to select and activate specific sub-populations with therapeutic potential.
No genetic modification of cells is required (i.e., no lentiviral vector)
Cell activation and expansion require more intensive cytokine stimulation (and sometimes feeder cells), and expansion phases are typically longer than in CAR-T workflows.
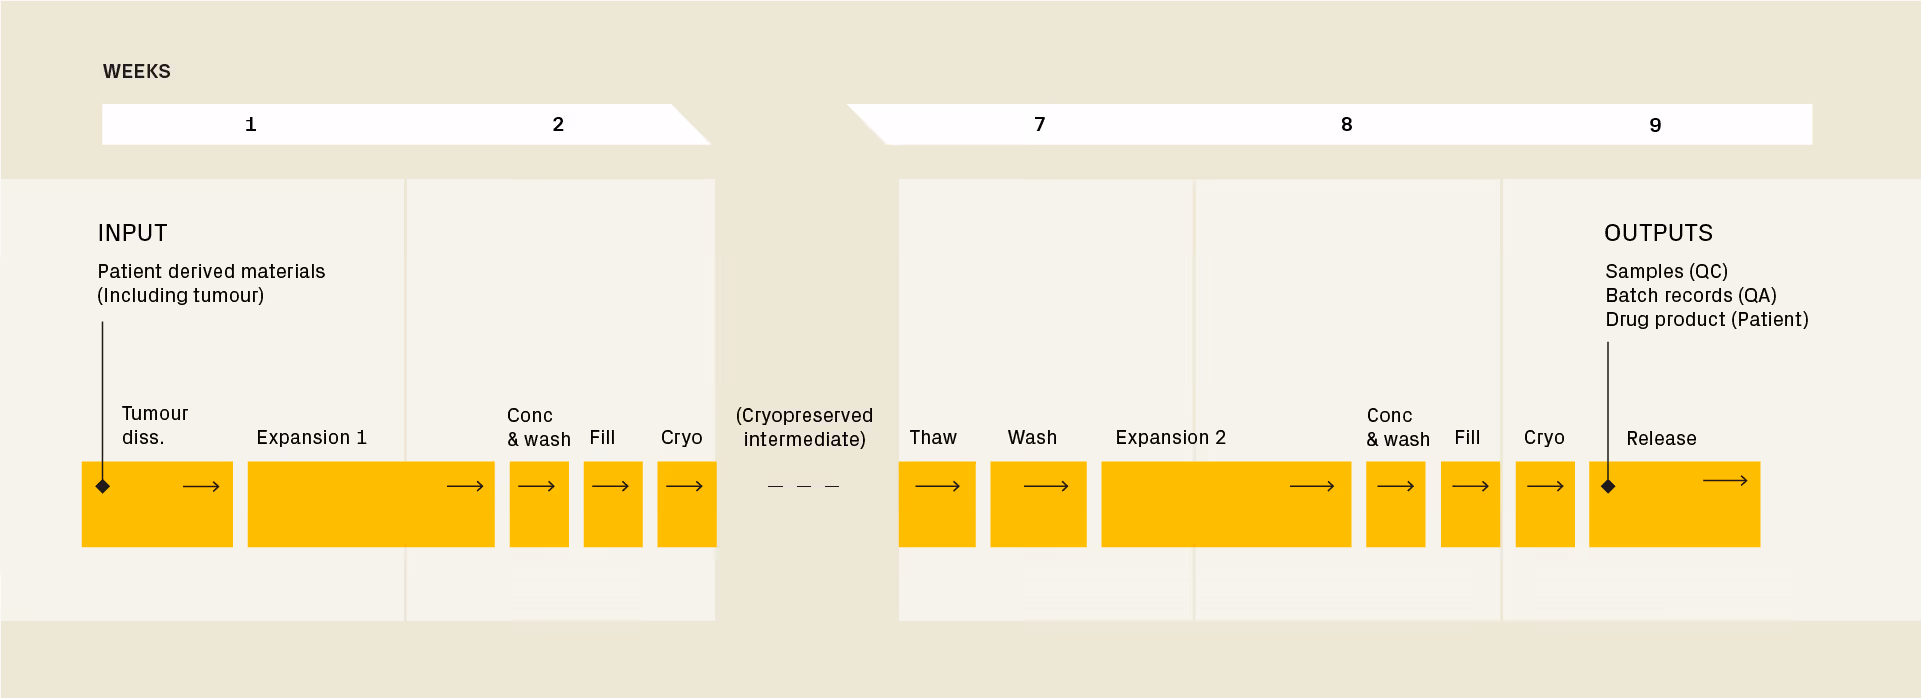
Steps modelled in the analysis include tissue dissociation, cell selection, pre-expansion and activation, cryopreservation, therapy-specific operations, thaw, expansion, harvest, fill finish, cryopreservation 2, quality control (QC).
Figure 1: Timeline for the manufacture of an autologous TIL therapy. Therapy-specific processes feeding into the second expansion step take several weeks. As a result, the drug substance needs to be cryopreserved until personalised reagents to enrich specific are available. Click here to enlarge.
Process modelling provided a structured way for the CGT developer to evaluate the scalability of their manufacturing strategy. In this guide, we examine how modelling supported four objectives:
Assess commercial viability at scale
Inform scale-up strategy and operational planning
Evaluate the impact of technology choices
Identify and prioritise technology gaps
1. Assess commercial viability at scale
Modelling COGS quantifies the cost dynamics of manufacturing a therapy by projecting cost per dose at clinical and commercial scales, pinpointing where automation or process optimisation delivers the greatest return and whether there is a viable route to scaled manufacturing.
Defining the workflow scenarios
Table 1 contrasts how the cost per dose changes for three increasingly automated workflows:
Process A – Baseline process with multiple manual and/or open steps. Cell counts and identity and potency assays are performed in-house, while compendial QC tests are outsourced.
Process B – Cost-efficient closure and/or automation of high-risk or labour-intensive steps. Two versions are modelled with compendial QC assays either outsourced or performed in-house for product release.
Process C – Partial roboticisation of certain frequent consumable set-up and liquid handling/sample preparation steps, alongside in-sourcing and automation of in-process and product release QC.
Cookie Information Table
Process
Tumour Processing
Cell Expansion
Concentrate and Wash
Cryo, Thaw
QC
QA
A
Baseline process with multiple manual and/or open steps. Cell counts and identity and potency assays are performed in-house, while compendial QC tests are outsourced
B
Cost-efficient closure and/or automation of high-risk or labour-intensive steps.
Closed, automated process
Closed, manual process
Closed, automated process
Closed, manual process
Two versions with outsourced or in-house compendial QC assays for product release
eBR for release by exception
C
Partial roboticisation of certain frequent consumable set-up and liquid handling steps
Closed, automated process
Closed, process. Roboticised most frequent consumable set-up, sampling and liquid touchpointst
Closed, automated process
Closed, roboticised process
In-house QC assays for product release
Automated sample prep
Integrated eBR and MES
Table 1: Operational configuration of increasingly automated CGT manufacturing workflows
Cost and operational impact of progressive automation
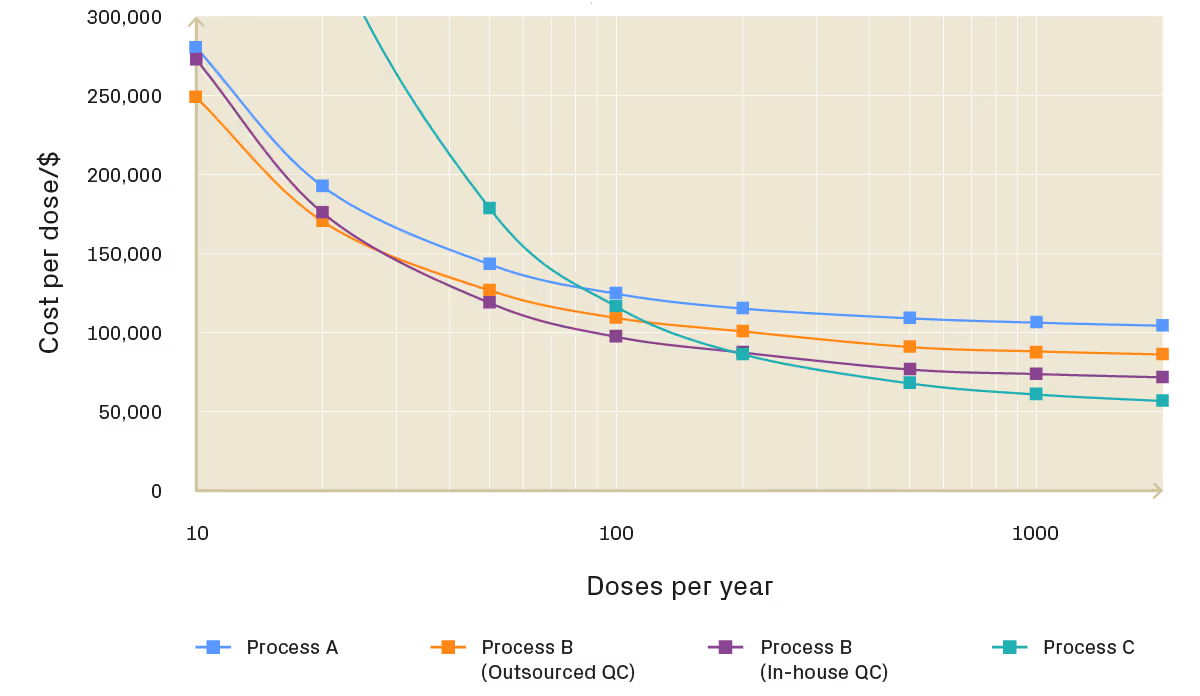
Figure 2: Cost of goods per dose at increasing production scale
The highly manual Process A shows a reduction in CoGS as scale increases, driven by improved equipment utilisation and stronger supplier leverage when procuring consumables. However, without process modelling, it can be tempting to assume these early economies of scale will continue to directly translate into commercial viability.
In reality, modelling shows that the operational efficiencies gained from manual processes typically plateau by the end of clinical development. For preclinical and early-stage therapy developers, continuing with a predominantly manual process becomes highly inefficient at scale, limiting long-term viability and weakening the value proposition for investors.
Process B addresses these limitations by closing the open steps in Process A and automating three of the four most labour-intensive operations. This includes adoption of commercially available automated cell-washing systems, implementation of electronic batch record (eBR) systems, and introduction of a custom front-end tissue dissociation solution to enable process closure. These targeted upgrades capture the majority of accessible efficiencies and represent pragmatic early investments for developers in Phase 1/2a seeking to support future scalability without significant capital burden.
Process C introduces partial roboticisation and automated in-sourced QC. Beyond approximately 200 doses per year, it delivers the lowest COGS. Importantly, cost reductions continue beyond 2000 doses per year, underscoring its importance for the industrialisation of cell therapy manufacturing. Under the model assumptions, process C eventually plateaus at approximately $55k/dose, around half that of the highly manual Process A. This leads to greater than $100M saved annually during the manufacture of a scaled therapy. At this stage, consumables and reagents become the largest single cost drivers, many of which are typically locked in from very early in development activities.
2. Inform scale-up strategy and operational planning
Holistic process modelling supports scale-up planning by forecasting operator numbers, equipment utilisation, and space requirements. This identifies whether processes that appear feasible from a cost perspective may fail due to challenging operational constraints, and whether there are breakpoints beyond which certain processes are strongly preferred.
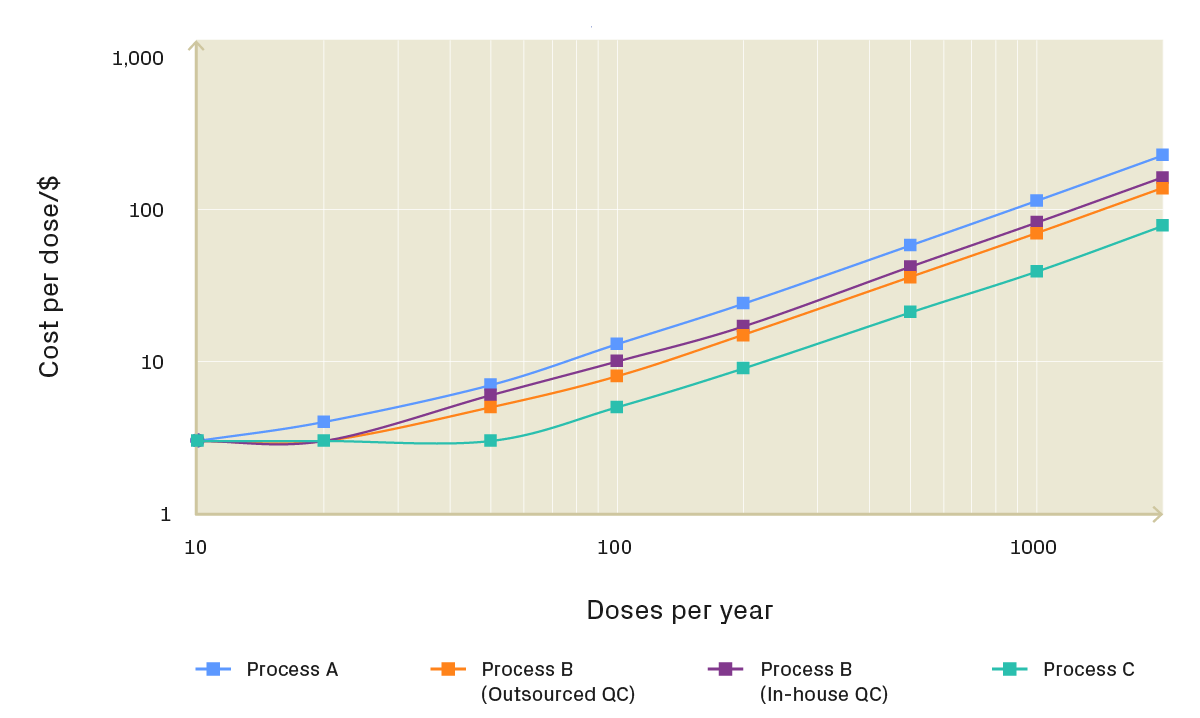
Figure 3: Staffing requirements at increasing production scale
Figure 3 shows that staffing requirements increase steeply for the predominantly manual Process A. Targeted automation in Process B moderates this growth, while Process C delivers the lowest operator requirement at scale through partial roboticisation and automated QC.
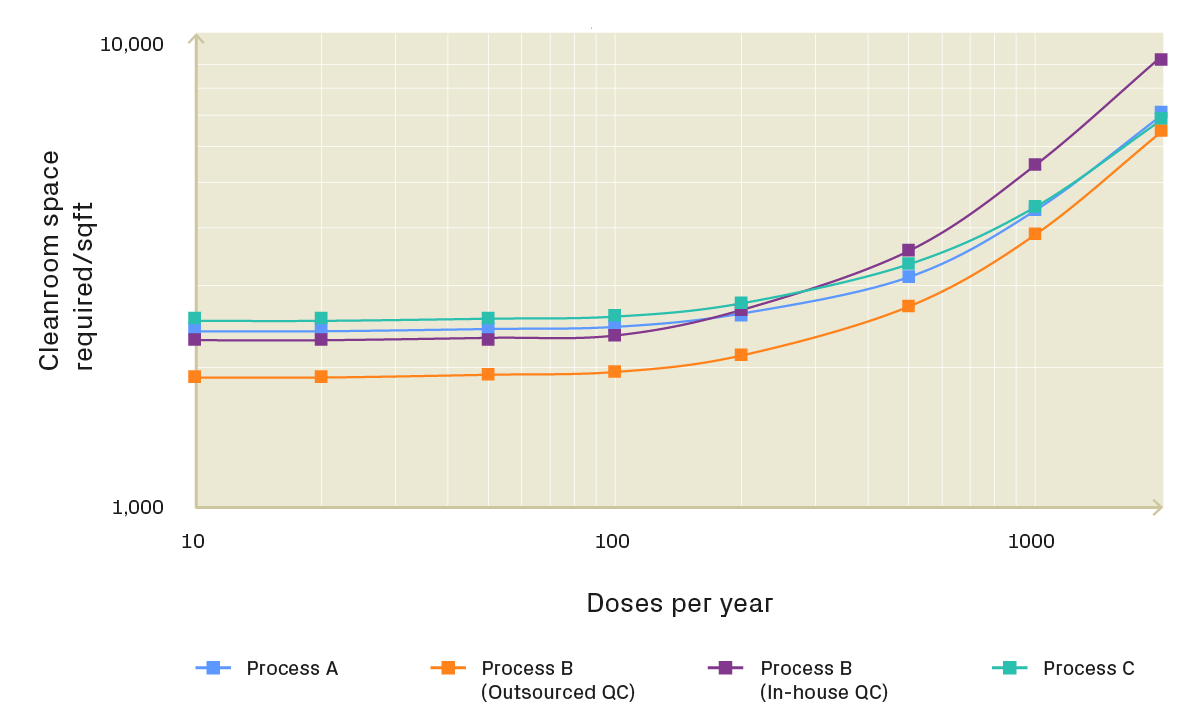
Figure 4: Cleanroom space requirements at increasing production scale
Figure 4 highlights similar differences in cleanroom space. Although in-sourcing compendial QC can reduce cost per dose (Figure 2), it increases space demand at higher volumes due to sterility testing workflows and additional operator interactions. Process C requires higher upfront investment but results in a more space-efficient manufacturing footprint as production scales.
Together, these figures demonstrate that scalability is not determined by cost alone. This analysis enables stakeholders to develop a realistic scale-up roadmap, indicating when cost savings are sufficient to justify investment in equipment, facility expansion, and additional operators.
3. Evaluate the impact of technology choices
Modelling captures how technology choices influence cost, space utilisation, facility requirements, and scalability simultaneously. Within the TIL workflow, the expansion step warrants particular attention. It is the single longest unit operation in the workflow, and therefore strongly influences incubator strategy and overall facility utilisation.
To understand its impact, we compare three scenarios for the expansion step:
A fully manual process based on G-Rex bioreactors.
An automated incubation platform based on an alternative bioreactor technology with a larger footprint but shorter expansion times and integrated process analytical technologies.
A robotic handling system based on G-Rex bioreactors.
All three of these options are closed as GMP-compliant solutions for suspension culture are readily available.
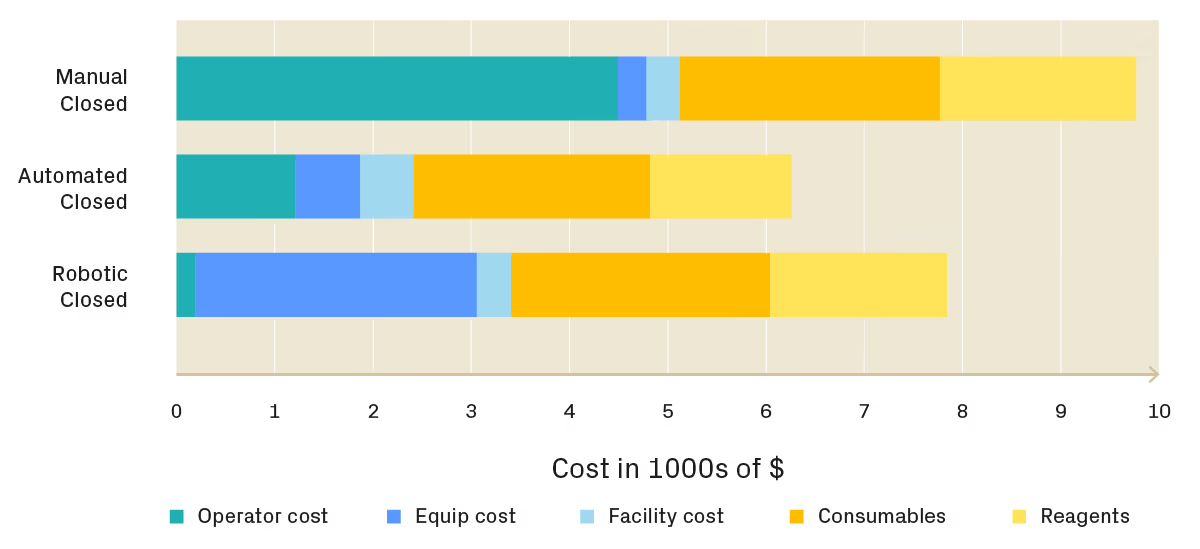
Figure 5: Automation reduces operator costs but increases equipment and facility costs due to higher hardware complexity and limited batch throughput, whereas G-Rex systems enable more efficient space utilisation.
Figure 5 shows that while automation reduces operator costs, these savings are partially offset by higher equipment costs driven by increased hardware complexity. For the automated expansion platform in particular, facility costs rise because the instrument can only process one batch at a time. In contrast, multiple G-Rex bioreactors can be stored in a single incubator for manual and robotic processes, improving space utilisation.
The cost breakdown also highlights that, on a per-dose basis, amortised facility fixed costs are not a major cost driver. This reinforces an important point: process closure is typically implemented to improve robustness, control, and manufacturability, not simply to reduce cost.
As shown in Figure 2, the automated cell expansion platform can reduce process COGs at lower production volumes. However, retaining a manual G-Rex-based process still provides a viable scaling pathway through the introduction of targeted robotic automation. In practice, robotic systems are most effective when introduced after core processes are stabilised.
Ultimately, the optimal technology choice depends less on headline cost and more on unit operation performance, and whether a given technology enables faster expansion, improved critical quality attributes, or better clinical outcomes.
4. Identify and prioritise technology gaps
The analysis of different manufacturing scenarios helps determine whether the throughput of available off-the-shelf manufacturing technologies can scale effectively to commercial production volumes. Because of the model flexibility, it also allows for the comparison of new vs old technologies, and even technologies that are not conceivable due to gaps in current technology landscape.
By undertaking this analysis, organisations can pinpoint technology gaps where custom development or targeted automation could improve product quality, reduce manufacturing costs, or enable progression from R&D methods to reproducible clinical production. Rather than reacting to bottlenecks late in development, modelling allows gaps to be identified early and investment prioritised based on operational and commercial impact.
For the TIL therapy described above, no commercially available GMP-compliant equipment was able to meet the company’s specifications for tissue dissociation. In addition, the process presented several operational challenges:
The tissue had to be transported from the hospital operating room to the manufacturing suite while maintaining sterility.
The tissue dissociation step was highly specialised and a major source of operator variability, with a potential impact on therapy Critical Quality Attributes (CQAs)
The process was open, requiring biosafety cabinets in a Grade B environment or isolators in a Grade C environment for sterile processing of patient tumours. This increased facility complexity and cost due to additional transition spaces, cleanrooms with high air change requirements, and made scheduling more challenging because open batches had to be segregated in time and space.
The manual processing of tumours took several hours and created a bottleneck, as it was the first step performed when patient material reached the manufacturing facility. This contributed to a peak operator loading on Day One and disrupted operator shift patterns.
To address these constraints, a custom, automated solution was developed: an integrated, closed manufacturing system comprising a sterile sample collection device that docks directly into a benchtop base station for controlled, automated tissue processing.
This design enabled operation within a lower cleanroom classification, reduced operator requirements per start, improved process consistency, and mitigated sterility risks, while maintaining product quality comparable to the manual process. The result was an immediate reduction in operating expenditure and a more scalable front-end workflow.
Insights from TTP’s cost modelling enable organisations to target development in the right areas, mitigating operational risks associated with labour-intensive, inconsistent, or difficult-to-scale processes. We work with our partners to develop equipment that addresses immediate manufacturing needs while supporting future scalability, alongside designing an end-to-end manufacturing roadmap to accelerate time to market.
Get in touch to learn how these process modelling methods can be applied to your own workflow. Understand how best to use existing equipment to accelerate clinical progress, identify technology gaps that could prevent commercial scale-up, and build a robust manufacturing roadmap.
About TTP’s Advanced Therapies Team
We partner with advanced therapy developers to translate the complexities and nuances of advanced therapies production processes into closed and automated manufacturing-ready systems. We work alongside your PD and manufacturing teams to co-develop GMP-compliant processes that benefit from scalability, cost-effectiveness, and throughput, while preserving the biological functionality and process innovations that give your therapies their competitive edge.
Our approach reduces development risk, shortens timelines, and accelerates scalable delivery of cell and gene therapies to patients, giving biotech leaders a greater chance of succeeding in a competitive market.
We help clients with all stages of their most complex and challenging technology and product development projects.
If you're considering the next steps along your innovation journey, why not get in touch?
Thank you! Your submission has been received!
Oops! Something went wrong while submitting the form.
Form unavailable due to browser restrictions.
Your current browser or privacy settings may prevent this form from appearing. Please enable third-party scripts or submit your details through [email protected]
Get the latest from TTP
Join our community to get the latest news and updates on our work at TTP.
You will occasionally receive expert insights from across our areas of focus and hear directly from our engineers and scientists on the newest developments in the field.
Join our community to get the latest news and updates on our work at TTP.
Form unavailable due to browser restrictions.
Your current browser or privacy settings may prevent this form from appearing. Please enable third-party scripts or submit your details through [email protected]
Lorem ipsum dolor sit amet, consectetur adipiscing elit. Suspendisse varius enim in eros elementum tristique.
Talk to us about your next project
Whether you would like to discuss a project or would like to learn more about our work, get in touch through the form below.
Form unavailable due to browser restrictions.
Your current browser or privacy settings may prevent this form from appearing. Please enable third-party scripts or submit your details through [email protected]